Reading Tracking and Book Analysis
In 2021 I started tracking my reading with Goodreads. I was hoping to read more and the Reading Glasses podcast turned me onto reading tracking apps. Apps like Goodreads allow you to track your reading like a journal, but I thought it could be fun to visualize my reading habits. While the StoryGraph app does offer a way to track your reading through data visualizations, it was not exactly what I wanted. So I decided to create my own visualizations.
Reading tracker
Below is a visualization of what I have been reading since I started tracking. Each book is represented by a "lollipop" marker which is explained to the left. Hovering over a marker reveals information on the book it represents, and clicking it takes you to a link where you can buy the book. You can hone in on a certain year and/or month with the "Year" and "Month" selectors.
Date Started:
Date Finished:
Pages:
Days Taken:
Pg/Day:
Aside from the fun of visually tracking my reading, I wanted to answer two questions:
- How has my reading pace changed with more recreational reading?
- What kinds of books do I tend to read?
I can give a good guess to both of these—I have gotten faster and anything by Stephen King or Agatha Christie—but I thought it would be nice to get more data-based answers.
How has my reading pace changed?
I plotted my average pages read per day for each book since I began tracking. Some preliminary investigations revealed that I read graphic novels more quickly than other books, so graphic novels are colored orange in this pace plot, while all other books are colored blue.
It may be difficult to see, but my reading pace has increased since I began tracking. To make it more clear I plotted box-and-whisker plots of the average pages per day by year on the right. The increasing trend is much more evident with this plot. While it could be that more reading has hastened my reading speed, it seems more likely that as I grew to enjoy reading more I dedicated more of my free time to it. I could try and track additional data to discover the reasons for this trend, but I would rather spend that time reading.
What are my wheelhouses?
A concept that frequently comes up on Reading Glasses is a reading "wheelhouse". The hosts, Brea Grant and Mallory O'Meara, use the term to refer to the genres, settings, character types, plot elements, etc. that tend to appear in the books you enjoy. Understanding your wheelhouse can help you gauge what book to grab next from your favorite library or independent bookshop.
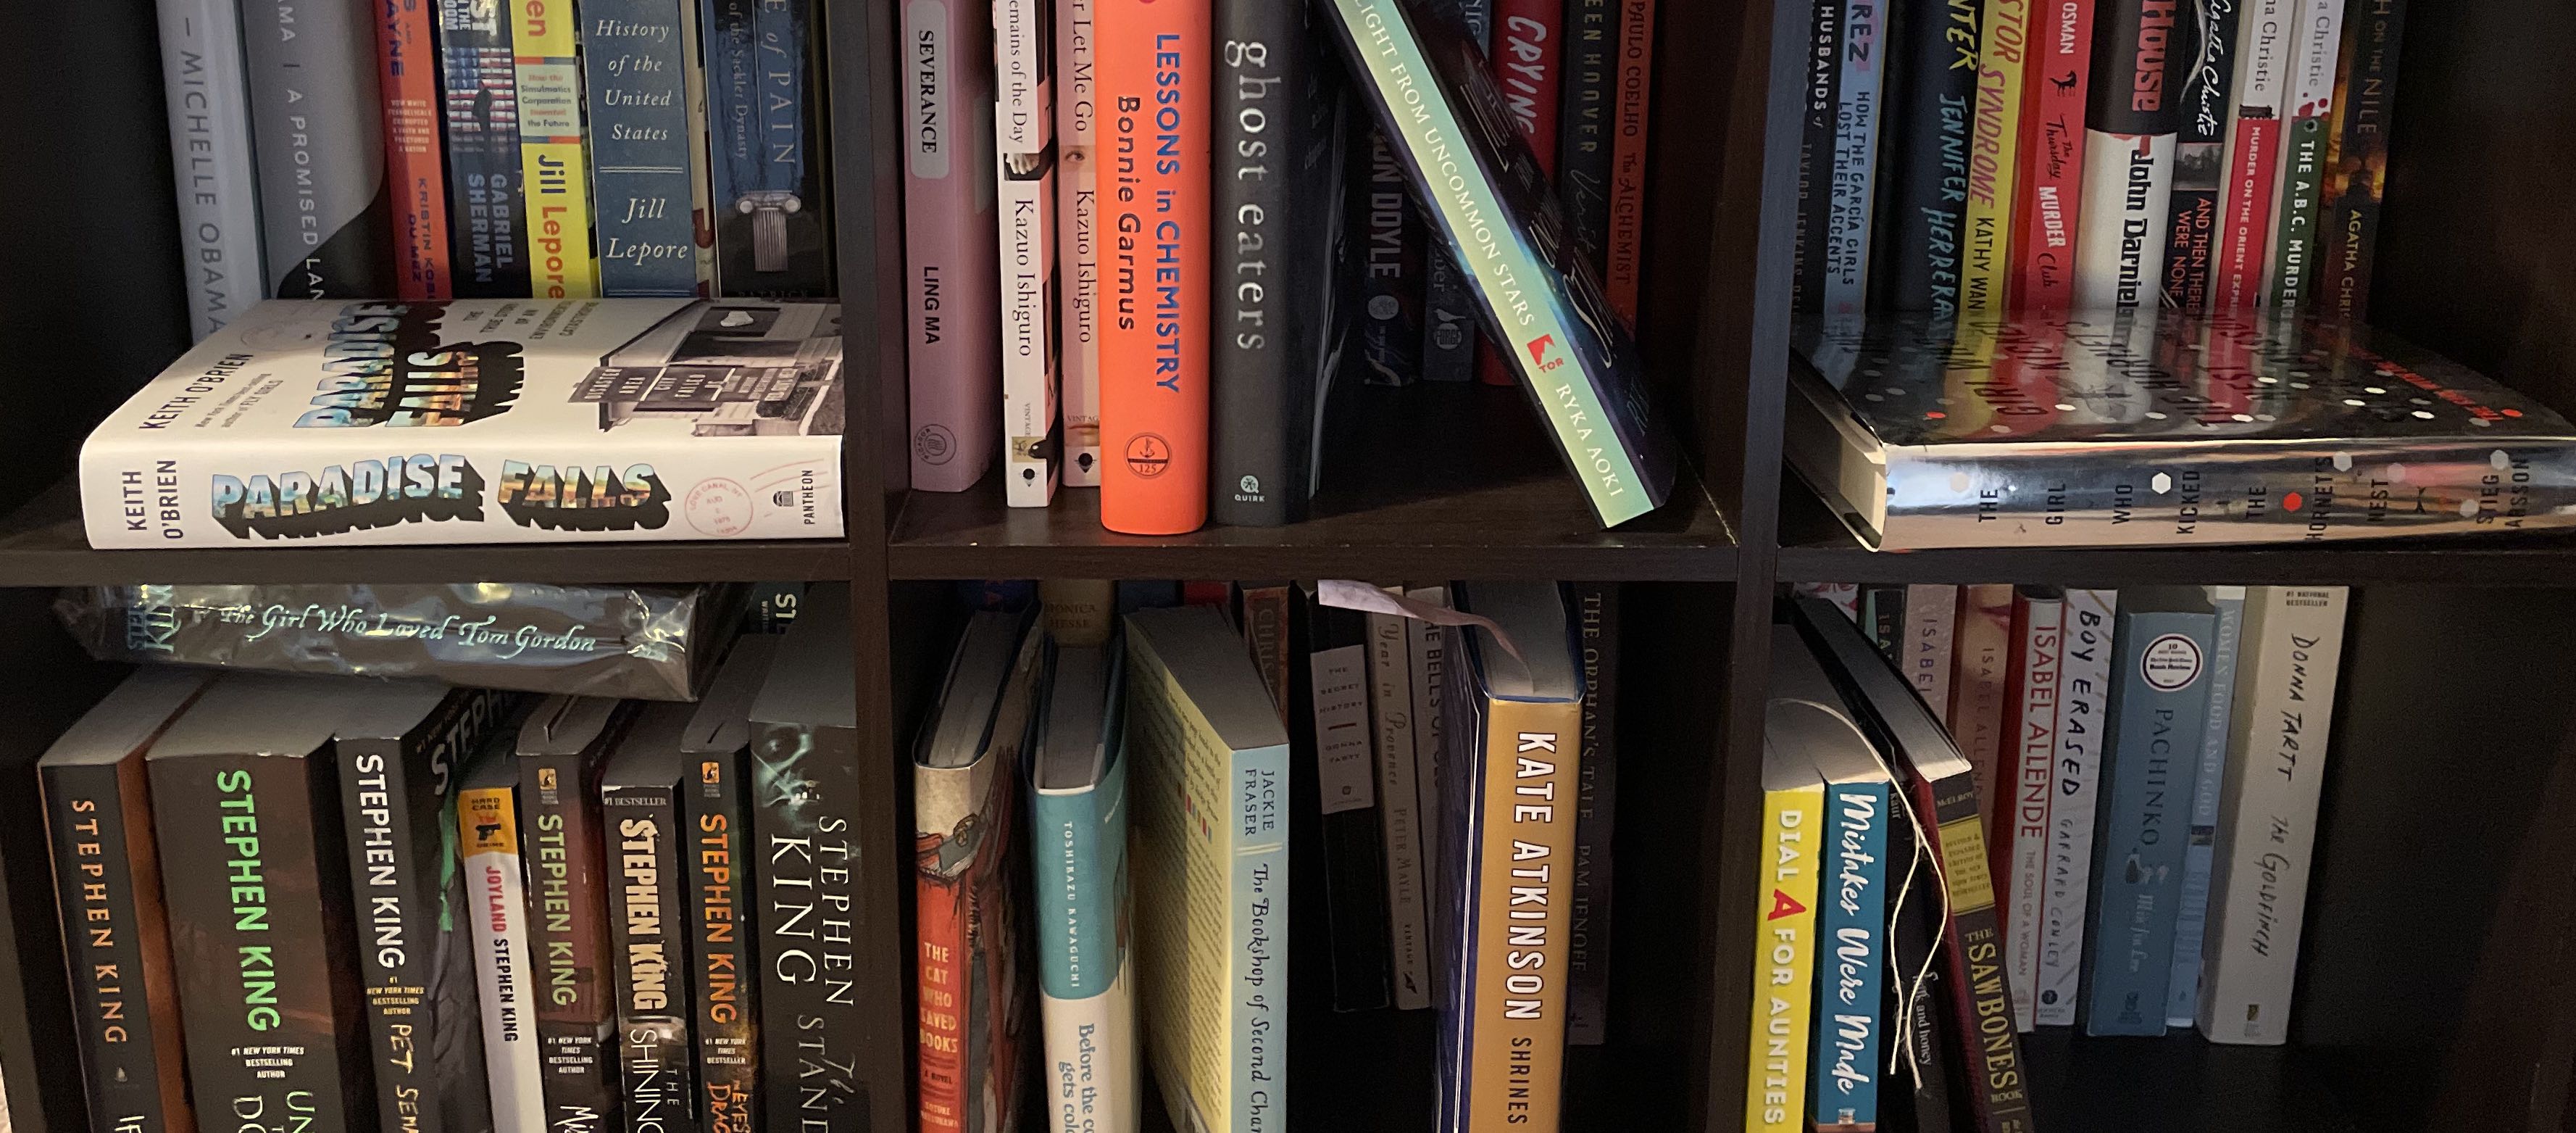
I attempted to discover my wheelhouses with the genre data available on Goodreads. Goodreads users can "shelve" their books on whatever self-labeled shelves they would like. Goodreads aggregates this data and provides the most popular shelves for each book in their database. For example, Stephen King's The Stand has Horror, Fiction, Fantasy, Science Fiction, Post Apocalyptic, Thriller, Dystopia, Audiobook, Apocalyptic, and Classics listed as its top genres, https://www.goodreads.com/book/show/9813753-the-stand. While this data does not capture more fine-grained wheelhouse descriptions — contemporary werewolf coming-of-age stories — it does provide an overarching sense of what genres I enjoy. After removing genres that are not really genres, like audiobook, I had what I needed to look for the wheelhouses in my reading history.
I turned to network science for genre analysis. I formed a network in which the nodes are the books I have read with two books being connected according to shared genres.1 I ran a community detection algorithm2 on this network. The resulting "communities" would be groups of books that tend to share the same Goodreads genres and will from now on be referred to as my wheelhouses.
You can see a visualization of the network at the wheelhouse level below. Wheelhouses are sized according to the number of books they contain and colored by fiction (blue) or nonfiction (red with hatching). Edges are sized according to the average edge weights between books in the two wheelhouses. Hovering over a wheelhouse reveals the books in that wheelhouse as well as their most common genres, while clicking it isolates the node so you can scroll through the information.
Wheelhouse:
# of Books:
Titles
Top Genres
By examining the different wheelhouses you can see the capabilities and limitations of this approach. For example, it captures a collection of books that seem to feature ragtag youths that find themselves in paranormal/supernatural horror situations (It, The Body, Meddling Kids) that I named "Losers Club Horror". On the other hand, The Perks of Being a Wallflower was grouped with all of the fantasy novels I have finished. However, I believe some of the seeming mismatches are due to a scarcity of data. I have not read a ton of books like Perks and so there are not many other books in my history for it to match. I suspect that as I continue to read, these "mismatches" will find new more fitting wheelhomes.
Speaking of 'continuing to read', I plan on updating these visualizations as I finish more books. While this post will be kept static, you can find the most up to date trackers at this post: Reading Tracking.
Notes
1. The weight of the edge from book A to book B is found by dividing the number
of shared genres between A and B by the total number of genres for A.
2. Specifically I ran the Louvain community detection algorithm
as described in
Blondel, Vincent D., et al. "Fast unfolding of communities in
large networks." Journal of statistical mechanics: theory and
experiment 2008.10 (2008): P10008.
The algorithm was run on the subnetwork of fiction books and the
subnetwork of nonfiction books separately, otherwise the two communities just reflected which books were fiction
and which were nonfiction.